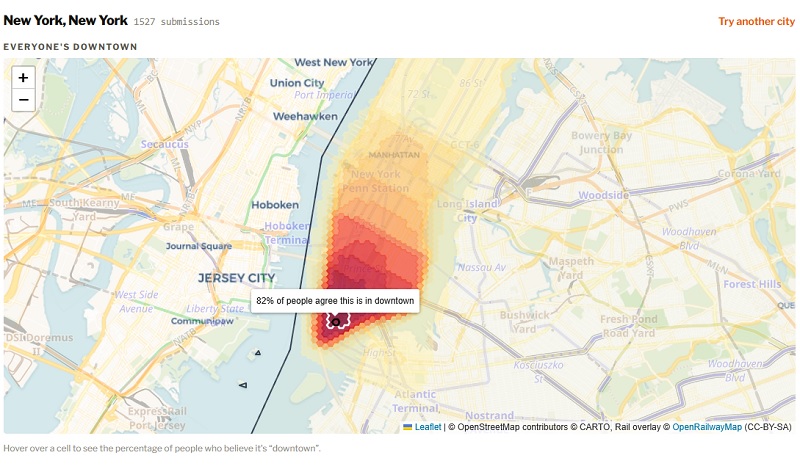

A new interactive web tool is turning one of urban life’s most subjective debates into data. Launched in early July 2026 by the Toronto-based project Observing the City, “Where is Downtown?” lets users select a city, draw the boundaries of what they personally consider downtown, and immediately see how their sketch compares to a growing global heatmap of other people’s definitions.
The simple premise has struck a chord. Within roughly a month of launch, more than 32,000 people across over 2,000 cities had contributed drawings. The resulting heatmaps reveal both consensus cores and surprising disagreements about where the urban heart actually ends.
Early patterns highlighted by the project’s creator include:
- New York City: Relatively sharp northern cut-offs often following major east-west streets.
- Chicago: Strong concentration on the Loop that still bleeds outward into surrounding areas.
- London: A distinctly bi-modal pattern rather than a single concentrated core.
Similar variation appears in other cities the tool has captured, from San Francisco and Seattle to Montreal and beyond. In places with strong official or planning definitions (such as Toronto’s TOCore boundaries or various municipal downtown improvement districts), the crowdsourced versions frequently diverge—sometimes expanding far beyond the business district, sometimes contracting tightly around transit hubs or historic cores.
The tool sits on Observing the City’s site alongside other data-driven urban experiments, including bicycle counter dashboards, TTC slow-zone trackers, and a companion “Where Would You Live?” map. Users are encouraged to share their personal downtown outlines on social media, further feeding the collective visualization.
The project taps into a longstanding conversation. City planners, census agencies, tourism boards, and residents have long produced competing maps of downtown—whether for zoning, economic analysis, or everyday directions. Statistics Canada, for example, delineates primary and secondary downtowns based on job density and mixed-use areas, while local plans and Wikipedia entries offer their own polygons. The new crowdsourced approach sidesteps those institutional lines and simply asks ordinary people: Where do you think it is?
As submissions continue to accumulate, the heatmaps are evolving into a living portrait of how residents and visitors across the world mentally carve up their cities. Anyone can add their own outline at observingthecity.ca/downtown-definer.